Epic SmatyChart.ai:
Simplifying Healthcare, One Patient at a Time
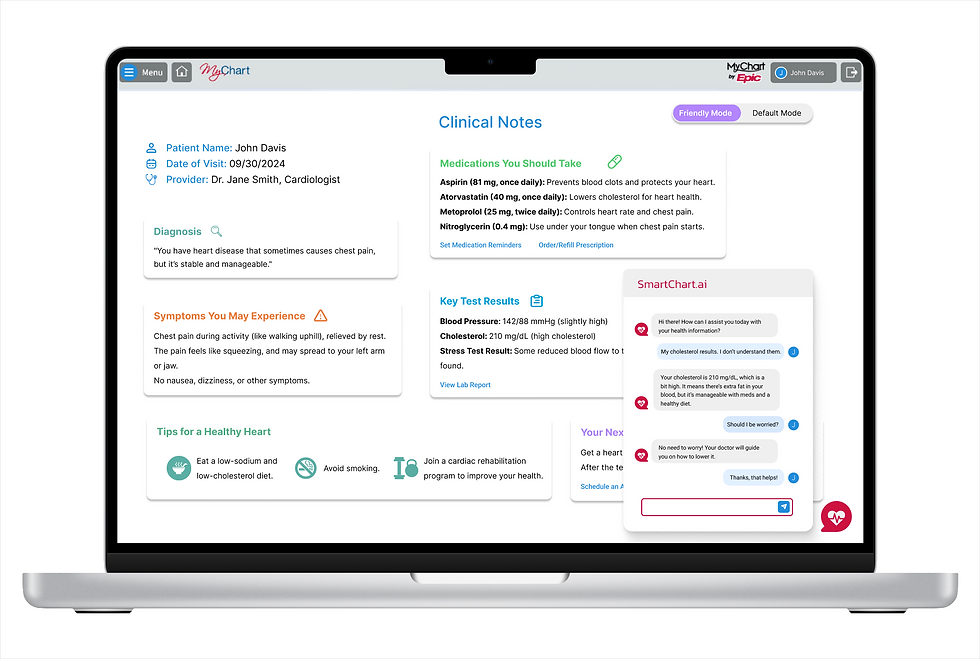
Designing an AI-powered “Friendly Mode” for the MyChart patient portal to helps patients better understand their own health data—without needing a medical degree.
Role
UX Designer & Product Owner
Scope
4 Months
(Aug - Dec 2024)
Tools
Figma
Miro
Google Doc

Due to NDA restrictions, I am unable to publicly share detailed visuals or internal documentation for this project. However, I’m happy to walk through the experience.
Mentors: Brandon Lusk, Brock Humblet, Dan Wortmann
Team: Tianyi Lin, Shan Bhutoria, Zisen Shao, Rithik Rajaram
.png)
Overall
🧠 The Challenge
When our team arrived at Epic Systems as part of our CS Capstone project, we were given a critical mission rooted in a growing challenge across healthcare:
"In recent years, healthcare has moved toward greater transparency by giving patients access to their medical data through online portals. However, much of this information—like test results and physician notes—is still written for healthcare professionals, making it difficult for patients to fully understand or act on their own health information."
We were asked to close this market gap by designing an AI-driven plugin—a “Friendly Mode”—to be embedded into patient portals like Epic’s MyChart. This plugin would process complex medical information and simplify it for patients directly within the browser, enhancing comprehension without altering the original clinical content.
Our solution:
SmartChart.ai, a conversational, AI-powered chatbot that guides patients through their health data using natural language explanations, reassuring context, and plain-language definitions. We were tasked with delivering a working prototype in just 12 weeks.
🔍 Understanding the Problem
We kicked off with qualitative research—interviewing MyChart users to understand where they struggled.
Key insights:
-
“I don’t understand half of what’s written, so I just Google it.”
-
“I’m not sure if something’s serious or routine.”
-
“I wish I could just toggle a simple version of the results.”
Patients didn’t want more data—they wanted clearer meaning and reassurance. Their needs shaped our design focus.
🔄 Our Process
To manage design + dev in parallel, we combined Scrum + Kanban frameworks.
-
Scrum: Weekly sprints with standups, retros, and rotating Scrum Masters.
-
Kanban (Jira): Each team member pulled from prioritized tasks. I maintained the product backlog and coordinated between design and development.
As both the UX Designer and Product Owner, I ensured our design decisions reflected real user pain points, and that those insights translated into feasible dev milestones.
✍️ Ideation & Concept Development
With time constraints in mind, we scoped three MVP features:
-
“Friendly Mode” toggle – for simplified test results and doctor’s notes.
-
Contextual hovers – offering plain-language popups for complex medical terms.
-
Conversational chatbot – for guided walkthroughs and emotional support.
I led a collaborative ideation sprint using Figma and Miro, sketching wireframes and user flows based on user scenarios from our interviews.
🎨 Wireframing the Vision
I created a low-fi prototype in Figma, then tested with 6 users (including real MyChart users).
What worked:
-
The toggle between simplified/original views felt empowering.
-
Summaries eased user anxiety.
-
Chatbot interactions made the experience feel more personal.
What we improved:
-
Made the chatbot draggable and resizable.
-
Added hover-based definitions for tricky terms.
Building the Experience
While the engineering team built the app in React.js, I continued to evolve the UX.
-
Integrated Gemini AI plugin for summarizing health data
-
Designed mobile-first, responsive screens
-
Shifted from web scraping to file-based inputs for quicker implementation
-
Conducted handoff with detailed design specs and Figma tokens
Results & Impact
In just 4 months, we shipped a high-fidelity prototype that:
-
Reduced user overwhelm by offering digestible medical summaries
-
Created a flexible foundation for a scalable AI patient-assistance plugin
-
Received positive feedback from mentors and healthcare users alike
📚 Lessons Learned
What went well:
-
Daily Slack syncs and Jira-based task flows kept us agile.
-
Design thinking guided all sprint planning.
-
Users felt “relieved” after seeing the simplified results—an emotional metric that really resonated.
🚧 What we’d improve:
-
Clarify web scraping feasibility earlier.
-
Start chatbot logic prototyping sooner.
🚀 Next Steps
-
Add natural language voice input for accessibility
-
Implement chat history and bookmarking
-
Scale to cover additional MyChart modules (e.g., prescriptions, radiology notes)
Reflection
SmartChart.ai wasn’t just a technical challenge—it was a human one.
The project reminded me that clarity, empathy, and trust are just as critical as functionality in healthcare design.
Serving as both the UX designer and the product owner pushed me to stretch across disciplines—and made this one of the most meaningful design experiences I’ve had.